

-

- No Comments
- January 3, 2026
How to get Synthetics monitoring to work in New Relic
1. Introduction
Synthetic monitoring might sound futuristic, but it’s a deceptively simple concept: it’s the practice of using automated scripts to simulate real user interactions with your website or APIs. Think of it as having invisible testers spread across the globe, constantly checking whether your digital services are up, fast, and performing exactly as they should.
In today’s fast-paced digital world, waiting for a user to report a broken page or slow-loading API is a recipe for lost revenue, frustrated customers, and damaged reputation. Synthetic monitoring lets you catch issues before they impact real users, offering proactive visibility into performance, uptime, and functionality.
Without synthetic monitoring, businesses often face costly surprises: websites going down unnoticed, critical API endpoints failing silently, or slow-loading pages driving visitors away. By implementing proactive monitoring, you transform uncertainty into confidence knowing that your digital presence is performing at its best 24/7.
2. Prerequisites for Using New Relic Synthetics
Before diving into New Relic’s synthetic monitoring setup, there are a few essentials to ensure a smooth experience:
- New Relic Account with Synthetics Enabled
- Synthetic monitoring is only available if your account has the feature activated. Log in via one.newrelic.com and navigate to the Synthetic Monitoring dashboard to confirm access.
- Supported Browsers
- For browser-based monitors (Simple Browser, Scripted Browser), you’ll need a modern version of Chrome or Firefox. These browsers power the automated tests, simulating real user interactions with high fidelity.
- Firewall and Proxy Configurations
- If your site is behind a firewall, you’ll need to allow access from New Relic’s public minion IP addresses.
- For sensitive or internal sites, consider using private locations, which run monitors within your network for accurate results without exposing internal resources to the public internet.
- Permissions and Security Considerations
- Ensure your team members have the correct access permissions to create and manage monitors.
- Synthetic monitoring data is non-personal, but always follow security best practices, especially when using credentials in scripted monitors.
With these prerequisites in place, you’re ready to move confidently into creating your first synthetic monitors, ensuring proactive monitoring from the start.
3. Types of Synthetic Monitors in New Relic

New Relic offers a variety of synthetic monitors tailored to different monitoring needs. Choosing the right type ensures you catch issues effectively and maintain optimal performance. Here’s a breakdown of the seven main types:
| Monitor Type | Description | Best Use Cases |
| Ping Monitor | Performs a basic HTTP check to see if your website or API is reachable. | Quick uptime checks for simple web services or endpoints. Ideal for detecting downtime instantly. |
| Simple Browser | Loads the full page in Chrome or Firefox to measure performance from a real browser perspective. | Testing page load times, performance metrics, and global availability. Perfect for public websites where user experience matters. |
| Step Monitor | Codeless workflow simulation using prebuilt steps like clicks, form submissions, or navigation paths. | Monitoring common user journeys (e.g., login flows or checkout processes) without writing code. |
| Scripted Browser | Custom JavaScript scripts for complex interactions, conditional logic, and credentialed actions. | Advanced testing requiring login, multi-step forms, or dynamic content. Essential for internal apps or complicated workflows. |
| API Tests | Scripted checks on endpoints, headers, response codes, or SSL certificates. | Monitoring API performance, availability, and correctness. Useful for backend services and integrations. |
| Certificate Check | Monitors SSL/TLS certificate expiration and alerts before expiry. | Ensures secure connections remain valid; prevents unexpected certificate expiration. |
| Broken Links | Scans pages for broken or unreachable links. | Identifying dead links on websites to maintain a seamless user experience and SEO health. |
By selecting the right monitor type, you ensure that every critical path whether user-facing or backend is continuously observed and issues are flagged before they impact customers.
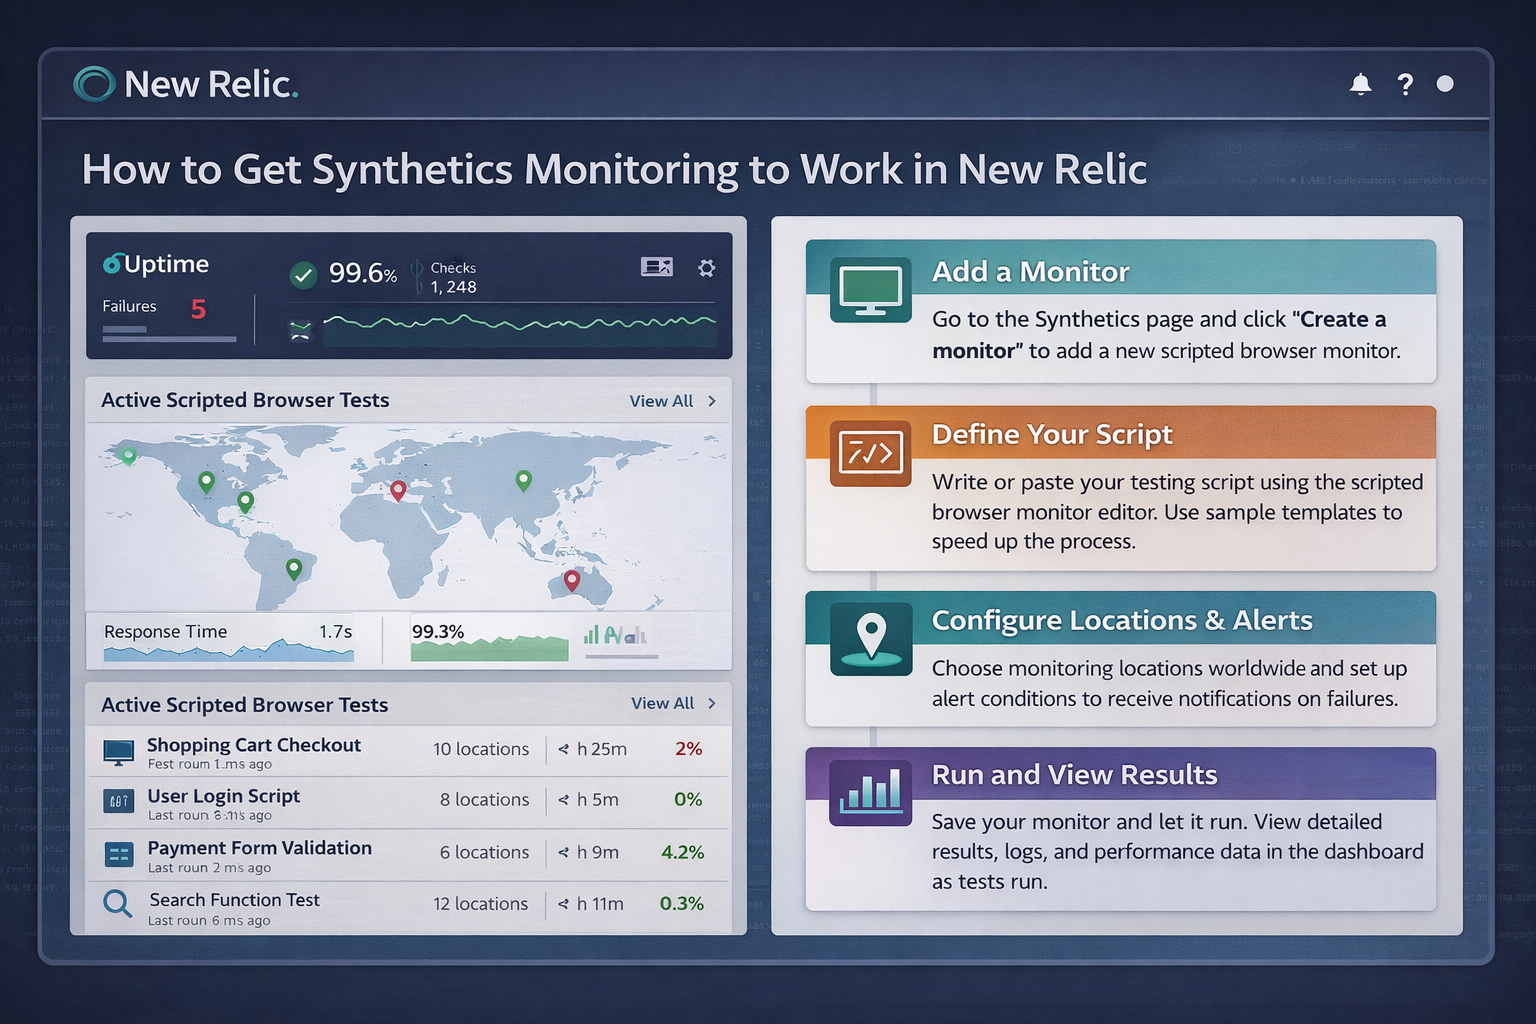
4. Step-by-Step Setup Guide
Getting your synthetic monitors up and running in New Relic is straightforward. Here’s a step-by-step guide:
Step 1: Log in to New Relic
- Visit one.newrelic.com and log in with your account credentials.
- Navigate to Synthetic Monitoring from the dashboard.
Step 2: Create a New Monitor
- Click “Create a monitor”.
- Select the monitor type based on your needs (Simple Browser, API Test, etc.).
Step 3: Enter URL, Locations, and Frequency
- Input the URL or API endpoint to monitor.
- Select 3 or more locations to ensure reliability and global coverage.
- Set the monitoring frequency (e.g., every 5 minutes) to balance responsiveness and system load.
Step 4: Configure Browser and Device Options
- For browser monitors, choose the browser type (Chrome/Firefox) and device emulation if needed.
- Optional: simulate different screen sizes or network conditions for more detailed performance insights.
Step 5: Validate the Monitor
- Run a test to ensure the monitor works correctly.
- Check that the locations can reach your site, and any scripted steps execute as expected.
Step 6: Scripted Monitors (Optional)
- For Scripted Browser or API monitors, use the built-in IDE.
- Insert code snippets for navigation, form submissions, or API authentication (e.g., $webDriver.get(“your-url”) or $secure.SECURE_USERNAME).
- Store credentials securely and avoid exposing sensitive data.
Once these steps are completed, your synthetic monitor will start collecting performance and availability data, giving you actionable insights to proactively maintain your digital services.
5. Viewing Data and Setting Alerts
Once your synthetic monitors are live, New Relic provides a wealth of data to help you stay ahead of issues before they affect real users.
Accessing Monitor Results and Metrics
- Navigate to the monitor’s Summary Page to see real-time results, including response times, availability, and uptime history.
- Dive into breakdowns to analyze performance by location, device, or browser type.
- Compare synthetic results with real-user monitoring (RUM) data for a full picture of how your site performs in production versus simulated conditions.
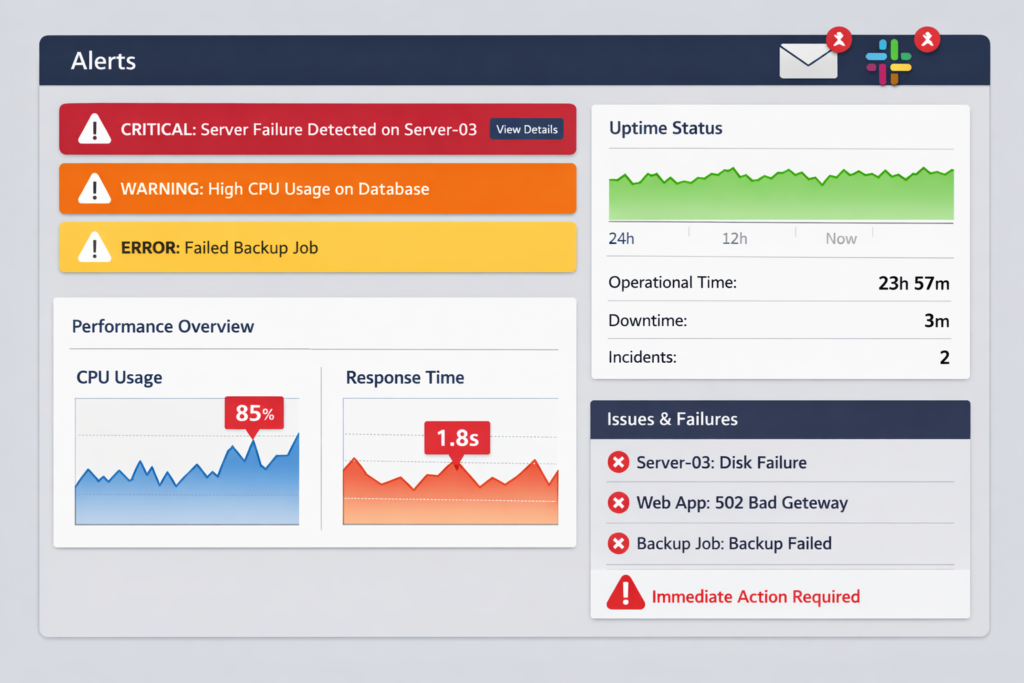
Setting Up Alerts and Notifications
- Alerts are configured via policies, allowing you to trigger notifications for failures or performance thresholds.
- Use the three-strike rule to reduce noise—alerts are only sent after consecutive failures, ensuring you’re notified of genuine issues rather than transient blips.
- Notifications can be sent via email, Slack, or other integrations, keeping your team informed in real time.
Automation Options
- Leverage NerdGraph API or Terraform to automate monitor creation, updates, and alerting policies.
- Automation ensures consistency across environments and scales easily as your monitoring needs grow.
Advanced Features
- Device Emulation: Simulate different screen sizes, devices, and network conditions to catch performance issues before real users experience them.
- Global Coverage Insights: Monitor from multiple locations worldwide, identifying region-specific latency or downtime.
6. Troubleshooting Common Issues

Even with proper setup, synthetic monitors can encounter issues. Here’s how to address common problems:
Monitors Not Triggering or Failing Tests
- Verify the URL or endpoint is correct and publicly accessible.
- Check firewall or network settings; consider adding public minion IPs or using private locations for internal sites.
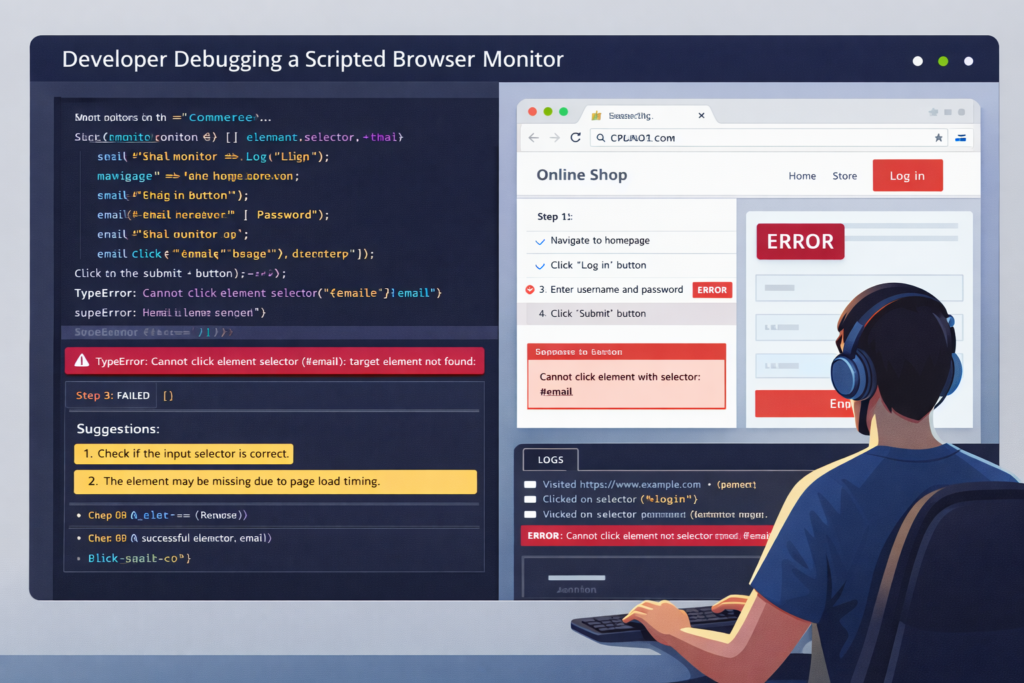
Handling Script Errors in Scripted Browser Monitors
- Review IDE logs for JavaScript errors or failed steps.
- Ensure credentials are correctly referenced and securely stored using $secure variables.
- Validate any conditional logic or navigation paths in your script.
Addressing False Positives in Alerts
- Adjust thresholds and failure conditions to prevent alerts from triggering on minor, temporary issues.
- Implement the three-strike rule to filter out transient errors.
Dealing with Blocked Locations
- If monitors fail from specific regions, confirm firewall or proxy rules aren’t blocking New Relic’s monitoring IPs.
- Use private locations for internal applications or restricted networks to maintain reliable monitoring.
By proactively addressing these issues, you ensure your synthetic monitoring setup remains reliable and actionable, giving your team confidence in the health and performance of your digital services.
7. Best Practices
Maximizing the effectiveness of New Relic synthetics monitoring isn’t just about setting up monitors—it’s about using them strategically. Follow these best practices to ensure your monitoring setup delivers reliable insights without unnecessary noise:
1. Choose the Right Monitor Type for Your Goals
- Match the monitor type to your specific needs: simple uptime checks for basic availability, scripted browsers for complex workflows, and API tests for backend endpoints.
- Avoid overcomplicating your setup start with essential monitors and expand as your monitoring maturity grows.
2. Balance Scheduling Frequency and Noise Reduction
- High-frequency checks (e.g., every minute) provide real-time insights but can generate excessive alerts.
- Use the three-strike rule and moderate intervals (e.g., every 5–10 minutes) to strike a balance between responsiveness and actionable notifications.
3. Use Private Locations for Sensitive or Internal Sites
- Internal apps or sites behind firewalls should leverage private locations to ensure accurate monitoring without exposing data publicly.
- Private locations also help test environments that are not accessible from the public internet.
4. Validate Scripts and Test New Monitors Before Production Use
- Always run test executions of scripted browser or step monitors in a sandbox environment.
- Verify that scripts handle dynamic content, conditional paths, and authentication properly.
- Ensure alerts are firing as expected and thresholds are tuned for realistic conditions.
Following these practices not only improves reliability but also ensures your team receives meaningful, actionable insights instead of being overwhelmed by false alerts.
8. Key Resources & Official Documentation
To make your setup smoother and more reliable, refer to these authoritative resources:
- Getting Started with Synthetic Monitoring:
https://docs.newrelic.com/docs/synthetics/synthetic-monitoring/getting-started/get-started-synthetic-monitoring/ - Monitor Types Overview:
https://docs.newrelic.com/docs/synthetics/synthetic-monitoring/using-monitors/intro-synthetic-monitoring/ - Additional Tutorials:
- Insider Announcer Step-by-Step Guide: https://www.insiderannouncer.com/getting-started-with-synthetic-monitoring-in-new-relic-a-step-by-step-guide/
- MindxMaster Guide: https://mindxmaster.com/how-to-configure-synthetic-monitoring-in-new-relic/
These resources provide official guidance, practical examples, and additional insights to help you fully leverage New Relic synthetics monitoring.
9. Related Topics / Further Reading
To take your New Relic synthetics monitoring setup to the next level, explore these complementary topics:
1. Scripting Best Practices for Browser Monitors
- Learn how to write clean, maintainable scripts for Scripted Browser monitors.
- Use reusable snippets, handle dynamic content gracefully, and secure credentials properly.
- Official New Relic Scripting Guide
2. How to Configure Global Monitor Locations
- Expand your monitoring coverage by selecting multiple geographic locations.
- Understand how regional differences affect performance and ensure your users worldwide get the best experience.
- Configuring Monitor Locations
3. Debugging Synthetic Scripts Effectively
- Identify and fix issues in scripts using IDE logs and step-by-step validation.
- Test scripts in sandbox environments before pushing them to production monitors.
- Debugging Scripted Monitors
4. Setting Up Alert Policies for Reliability
- Design alert policies that reduce noise but catch genuine issues.
- Use strategies like the three-strike rule, threshold tuning, and integration with messaging platforms for team notifications.
- New Relic Alert Policies Guide
Diving into these topics ensures your monitoring setup is not only functional but optimized, giving you actionable insights and greater control over your digital performance.
10. Conclusion
Synthetic monitoring isn’t just a nice-to-have it’s a critical tool for maintaining website and API reliability. By simulating real user interactions and proactively detecting issues, it helps you prevent downtime, performance bottlenecks, and frustrated users before they happen.
Start small: implement essential monitors first, test scripts carefully, and expand your coverage as you gain confidence. Regularly review your alerts, validate scripts, and refine monitor configurations for maximum effectiveness.
With a thoughtful approach, New Relic synthetics monitoring becomes more than a tool it becomes a cornerstone of your proactive digital strategy, keeping your services performant, reliable, and ready for your users anytime, anywhere.
Key Reference Links:
- Getting Started with Synthetic Monitoring
- Monitor Types Overview
- Insider Announcer Tutorial
- MindxMaster Guide
FAQ: New Relic Synthetics Monitoring
1. What is the difference between a Simple Browser and a Scripted Browser monitor?
- A Simple Browser monitor loads a web page in a real browser (Chrome/Firefox) to track performance and availability with minimal setup.
- A Scripted Browser monitor allows custom JavaScript scripts for complex workflows, logins, multi-step forms, and conditional actions.
2. How many locations should I select for my monitors?
- Selecting 3 or more global locations ensures reliable testing and helps detect region-specific performance issues. Fewer locations may miss intermittent regional downtime.
3. Can synthetic monitoring detect SSL certificate expiration?
- Yes! New Relic’s Certificate Check monitor automatically tracks SSL/TLS certificate expiration and can trigger alerts before certificates expire.
4. How do I avoid false alerts from synthetic monitors?
- Use strategies like the three-strike rule, tune thresholds appropriately, and test scripts thoroughly. This ensures only genuine failures trigger notifications.
5. Is it possible to automate monitor creation and management?
- Absolutely. You can use the NerdGraph API or Terraform to automate the creation, configuration, and alerting of monitors, saving time and maintaining consistency across environments.


